If you need to manage a complex project that involves numerous team members spread across the world and that will take a long time to complete, a Gantt chart can streamline the process. We will discuss what Gantt charts are, the benefits they provide, how you can use them, and the top software featuring these handy developer tools.
What Are Gantt Charts?
Henry Gantt, a management consultant and engineer, is the father of the Gantt chart, which launched in its traditional form in the early 1900s. Many consider the modern Gantt chart (aka modern timeline) to be one of the top project management toolsas it allows you to view scheduled tasks and gain valuable insight into a project’s overall progress.
Today’s Gantt chart has come a long way since the 1900s, as it is now generated by computers. It is a visual diagram that makes use of timelines, bar charts, and nested lists. The typical Gantt chart has a list of activities on its left-hand side. The entire right-hand side consists of an interval timeline at the top that often uses days or weeks to measure time. Next to each activity, you will find a horizontal taskbar labeled with its duration.
Although Gantt charts seem to come in all shapes and sizes, most have the same essential components. The first is the date and time. Each task’s date and duration is often displayed in days, weeks, or months, but you may see minutes or hours, depending on the project. The current day or time is often highlighted to show the viewer where everything currently stands. Each rectangle in the Gantt chart may vary in length, as it represents the duration or how long the task will take to complete.
Reading: Best Project Management Tools for Developers
The second key component of Gantt charts refers to the tasks or items. These are the individual activities taking place in the project.
Gantt charts’ third and final key component is the owner or the person in charge of the task. In some cases, the owner can be multiple people or an entire team.
You can create a Gantt chart from scratch to fit your customized needs. You can also take the quicker route by using Gantt chart software templates. Lastly, some project management software may have Gantt chart tools as part of their feature set.
By looking at a Gantt chart, a project manager or team member can instantly see which tasks get tackled first and which will be completed later on in the project so you can gain a general sense of the sequence involved. You can also see which tasks will take the longest to complete and may require the most resources. Critical task dependencies can also be attained by looking at a Gantt chart, so you can see how certain tasks may be connected to one another. With a Gantt chart completed, each team member can see what they need to work on and when. Most importantly, they can see how crucial their role is by viewing how their task can impact the overall project’s success.
What Are the Benefits of Gantt Charts?
Perhaps the most significant benefit that Gantt charts provide is simplifying project planning and management. As a project gets more complex, a Gantt chart can help you streamline the process by identifying the project’s critical path. The critical path refers to a situation where a single task can delay a linked sequence of tasks, which can prevent an entire project from getting completed on time. Managers use the critical path approach to see which tasks must be completed to finalize a project. With a Gantt chart, you can quickly see which tasks are critical to completion and which are not, so you can set individual deadlines and milestones to get a clearer idea of how long a project will take.
Gantt charts can help developers easily prioritize and sequence tasks, link dependent tasks, and discover the longest sequence of tasks and their duration. They can also help programmers chop down massive tasks into smaller, more manageable ones to make projects seem less daunting.
Beyond those primary benefits of Gantt charts, you can reap far more rewards by using tools that result in seamless workflows. Nobody creates Gantt charts better than computers, as evidenced by some project management software solutions currently on the market. With them, you can enjoy interactive and dynamic Gantt charts that can be optimized via plugins, add-ons, and integrations.
Reading: Project Management Software for Developers: A Complete Guide
How Do Developers Use Gantt Charts?
Developers can use Gantt charts in many ways. For starters, they can see when tasks need to start and when they must be finished. They can discover what the different tasks are, how much they cost, and how much the entire project costs. If any tasks depend on others to be completed, the Gantt chart will let the developers know. They can also see the current progress of the project and its entire duration.
Top Gantt chart tools
There are several Gantt chart tools and project management software solutions at your disposal. Here are some that may fit your software development team’s needs.
GanttPRO
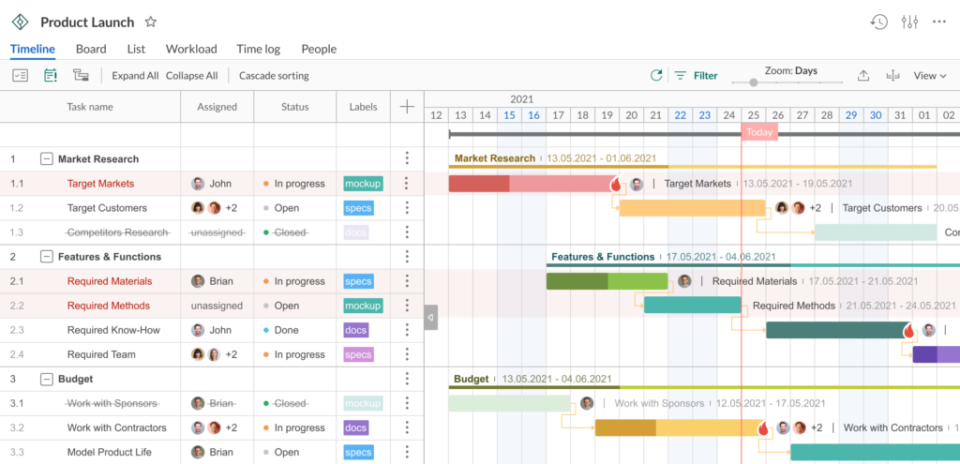
As you can tell by its name, GanttPRO is a tool that is all about Gantt charts. It is one of the most popular Gantt chart tools on the market since it is easy to use and employs quick and painless drag-and-drop functionality.
Gantt PRO is a solid pick if you want to jump into using Gantt charts without paying a premium. Unlike other project management tools, it focuses more on Gantt charts and all of the benefits they can provide.
You can track workload, split tasks and subtasks, merge dependencies, assign permissions to different team members, and more. And to save time, GanttPro will maintain your history, just in case you need to undo changes made by mistake.
Reading: Review of GanttPro Project Management Software
wrike
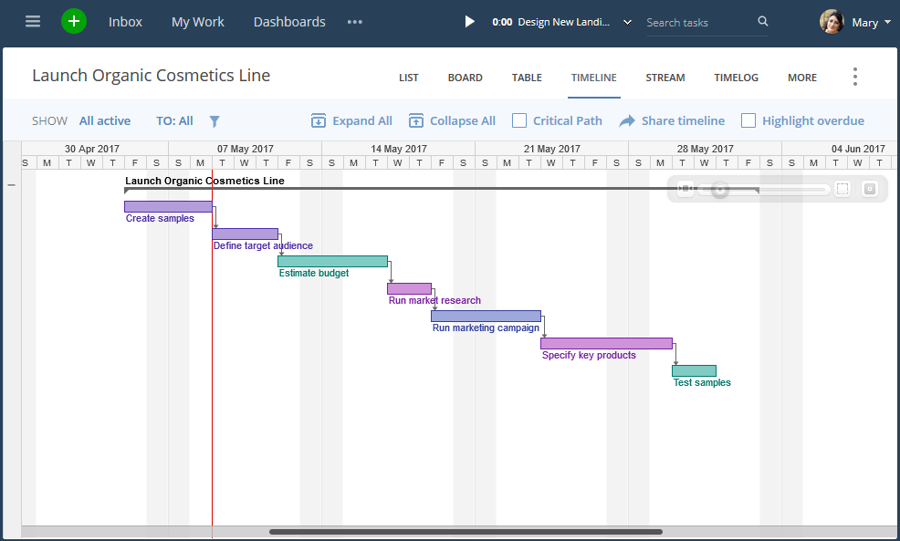
wrike is a project management tool that features interactive Gantt charts that are incredibly easy to use and understand. Its workload view lets you see performance and responsibilities, and your team can also use the app to collaborate with ease so they can focus on finishing tasks instead of having to attend time-consuming meetings. Wrike lets you change dates and deadlines and drag and drop tasks on the fly if needed. Thanks to the dynamic timeline feature, any changes will lead to automatic adjustments shared with your team.

Reading: Wrike Project Management Software Review
TeamGantt
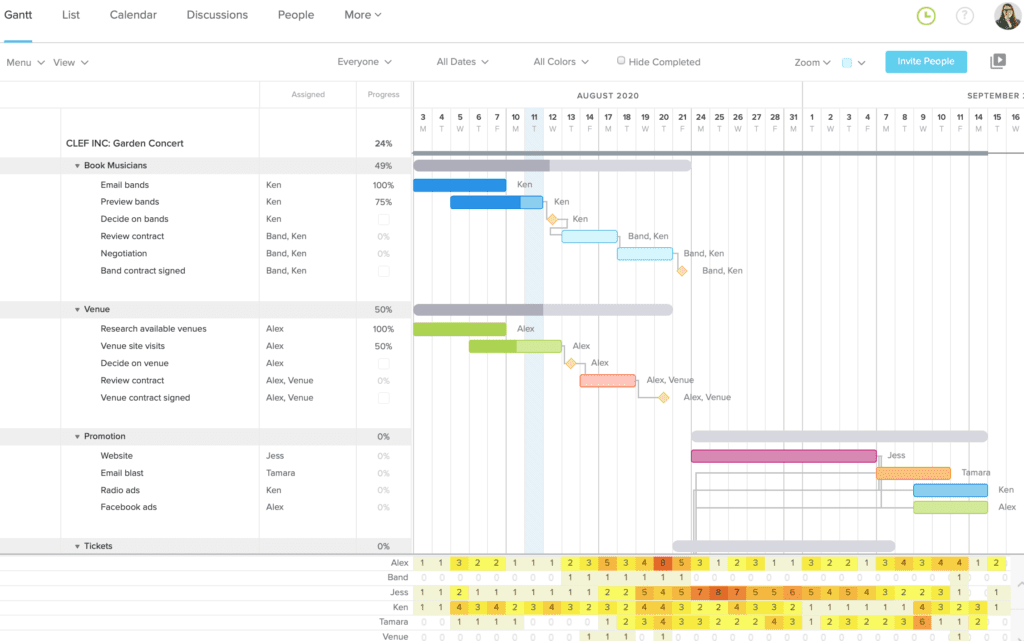
Some of the biggest names in the world use TeamGantt to manage their projects, including Netflix, Amazon, and Nike. Creating Gantt charts is a breeze here, and so is inviting teams and outside clients aboard for collaboration.

While Gantt charts may be your focus when using this PM software tool, you will also have the option to switch between Kanban board and calendar views with one click. As with other Gantt chart tools on this list, TeamGantt employs drag and drop functionality, making it easy to use with no training necessary.
Reading: Best Project Management Software for Game Developers
instantaneously
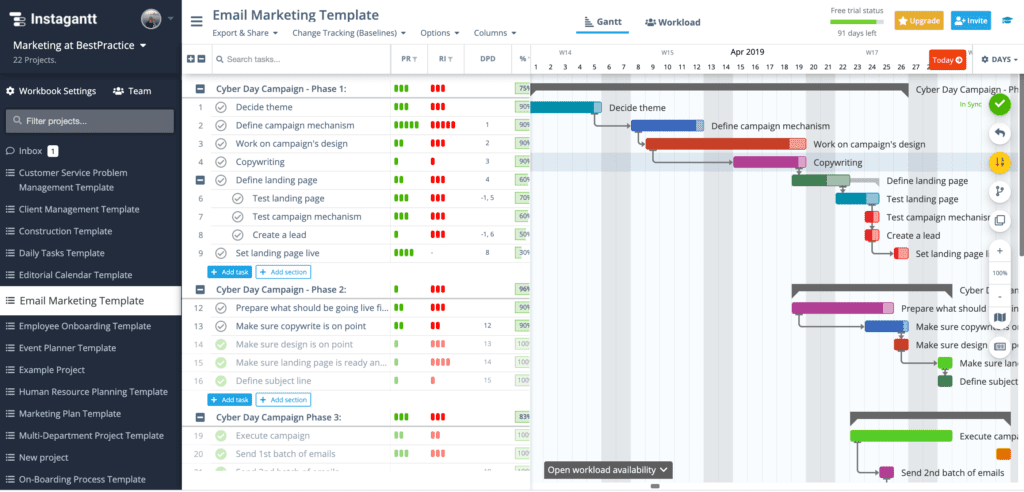
instantaneously makes Gantt charts easy thanks to its bevy of features that include drag and drop, tasks and subtasks, critical path, dependencies and milestones, custom view and fields, baselines, multiple projects, and workspaces, and estimated and actual cost. There are also several team collaboration options to keep everyone on the same page as your project progresses.

read more project management tutorials and PM tool reviews and comparisons.
