ether (ETH) price technicals suggest that 35% gains are in play by March 2022 due to several bullish technical and fundamental factors.
Ethereum price rises above two key moving averages
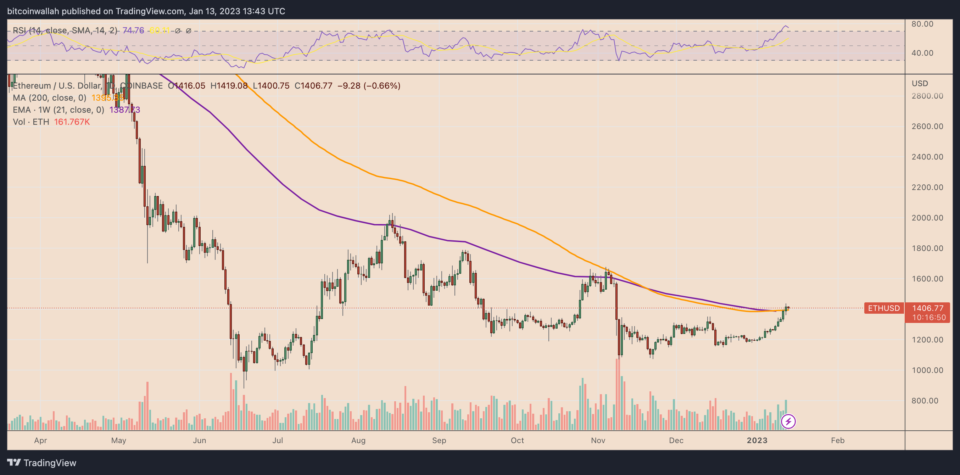
On Jan 8, Ether’s price crossed above its 21-week exponential moving average (21-week EMA; the purple wave) and 200-day simple moving average (200-day SMA; the orange wave).
Historically, these two moving averages have separated bull and bear markets. When ETH price trades above them, it is considered to be in a bull market, and vice versa.
ETH/USD daily price chart feat. 21-week EMA and 200-day SMA. Source: TradingView
The last time when Ether crossed above its 21-week EMA and 200-day SMA was in April 2022. But this was a fakeout, in part due to the collapse of Terra (LUNA) the following month.
But while Ether’s MA crossover does not guarantee further gains, the upside potential becomes greater if one looks at it in conjugation with other bullish factors, described below.
Ethereum’s Shanghai hard fork, shark accumulation
Ether’s price has risen by up to 20% in the first two weeks of January 2023, driven upward by an easing macro outlook and growing anticipation of Ethereum’s upcoming Shanghai upgrade.
The upgrade is expected to go live in March, and will enable withdrawals of staked ETH.
Related: 5 signs that an altcoin bull run could be underway
several experts, including Messari research analyst Kunal Goel and IntoTheBlock head of research Lucas Outumurobelieve the Shanghai upgrade will make staking Ether more attractive despite the sell-off risks of unlocking a large chunk of Ether’s supply.
Meanwhile, a rise in Ethereum’s richest addresses is already underway by entities called “sharks” that hold anywhere between 100 and 10,000 ETH. The number of sharks has grown by 3,000 since November 2022, according to data from Santiment.
 Ethereum shark addresses. Source: Santiment
This suggests strong accumulation of ETH, which may be a key reason behind ETH’s current rebound so far in 2023.
ETH price eyes breakout above key trendlin
From a technical perspective, Ether is eyeing a breakout above a resistance confluence, namely the 50-3D EMA (the red wave) near $1,395, and a descending trendline that comes as a part of a prevailing symmetrical triangle.
 ETH/USD three-day price chart. Source: TradingView
In other words, a decisive close above the confluence could have ETH pursue a run-up toward its next upside target at its 200-3D EMA (the blue wave) near $1,880, up around 35% compared to current price levels.
Interestingly, the $1,880 level was instrumental as resistance in May 2022 and August 2022.
Conversely, a pullback from the confluence would increase Ether’s possibility of undergoing a correction toward the symmetrical triangle’s lower trendline around $1,200, or a 15% price decline from current levels.
This article does not contain investment advice or recommendations. Every investment and trading move involves risk, and readers should conduct their own research when making a decision.
