Bitcoin (BTC) has an important new price target for bulls to meet — and it is closer than it seems.
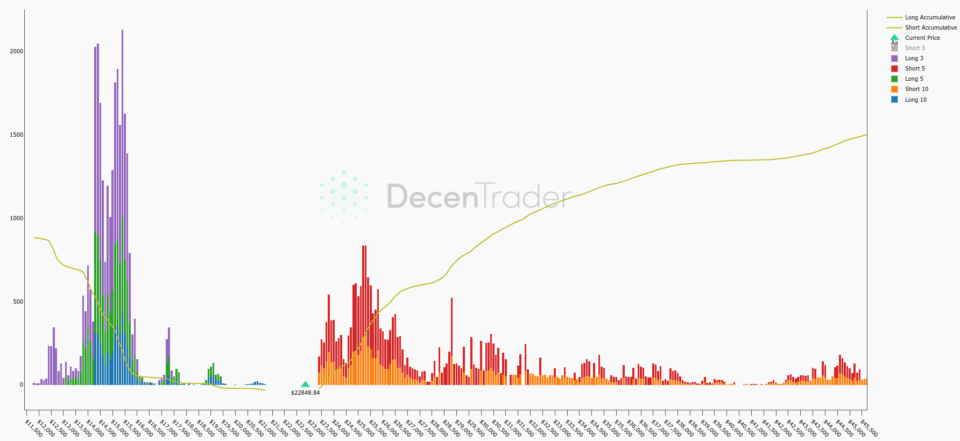
ace noted by Philip Swift, co-founder of trading suite Decentrader, $25,000 is now a critical BTC price level.
Bitcoin price rally near “a lot of liquidity”
After putting in 40% gains in January, Bitcoin continues to consolidate around the $23,000.
Opinions are split as to what will happen next — after more than a year of bear market, plenty of market participants expect a dramatic correction and even new multi-year lows of $12,000 or worse.
Others believe that the good times can continue and even see BTC/USD reach $30,000 before checking its relief rally.
In the meantime, however, some are focused on another line in the sand much closer to the current spot price.
For Swift, the area around $25,000 is now especially significant. This, he noted in a tweet on Jan. 24, is where bears begin to get liquidated en masse.
It is also the site of Bitcoin’s 200-week moving average (WMA), a key trend line which has been absent from the chart since the middle of 2022, when it failed to act as support. Bitcoin has since spent a record amount of time below the 200WMA, which currently sits at around $24,750.
“There is a lot of liquidity from $24,700 – $25,900 which lines up with the 200WMA and the area just above it,” Swift commented.
BTC/USD liquidity chart (screenshot). Source: Decentrader
Analysis of an accompanying liquidity chart shows that leveraged short positions will start seeing liquidations once BTC/USD passes $23,400 — so far, this is exactly where the rally has encountered momentum problems.
“This level continues to act as resistance,” trader and analyst Rekt Capital wrote in part of commentary about the topic, noting that Bitcoin’s latest weekly close was also lower.
“BTC needs to reclaim this ~$23400 as support to move higher, otherwise there is a risk of a new Lower High forming relative to the Summer 2022 highs.”
Such a scenario would mean BTC/USD fails to crack its local highs from August, these in themselves marking brief respite in the 77% drawdown from the all-time highs seen in November 2021.
 BTC/USD annotated chart. Source: Rekt Capital/ Twitter
August 2022 highs keep bulls in check
Continuing, Rekt Capital drew attention to the fact that the summer highs also present a resistance zone on longer timeframes.
Related: Bitcoin price stays near $23K as data shows hodlers not selling BTC
Analyzing the monthly chart in his latest YouTube updateshe underscored the need to break through that resistance, which is still “reaffirming itself.”
“If this continues to be the case, then we could set ourselves up for a dip just to reaffirm this level as support,” he argued, referring to the monthly range lows, which Bitcoin lost thanks to the FTX debacle.
A short-term prediction suggested that “some consolidation could take place for as long as it needs to take place before there is a break to either side of the range.”
A trip below the range low, Rekt Capital added, which nonetheless was not out of the question.
 BTC/USD annotated chart. Source: Rekt Capital/ Twitter
The views, thoughts and opinions expressed here are the authors’ alone and do not necessarily reflect or represent the views and opinions of Cointelegraph.
